This release is available in native packages for OSX and Linux as well as a Linux virtual machine. The package is built upon the multi-platform Python distribution “Anaconda”, from Continuum Analytics. The packages also contains an installer for maximum convenience.
The OSX package has been tested on 10.8 and 10.9. The OSX package comes with an app launcher that allows OS file associations to be made for GPI. File associations that GPI understands by default are .png, .jpg, .csv, .hdf5, .data, .list, .raw, .npy, .lab, .par, .rec, .pickle and .sin.
The Linux package has been tested on Ubuntu 12.04, 13.04 and 13.10. GPI on 13.10 requires XFCE or KDE desktop managers for faithful GUI display. The Linux VM uses Ubuntu 12.04.
Several packaged libraries have been updated including numpy, scipy, and matplotlib. Pyopencl has been included in the OSX package.
GUI Updates
- The status bar now contains the canvas walltime and total port memory held by the canvas.

More canvas info.
-
Multi-drag-n-drop is now supported by the canvas. This includes network files, associated files, and GPI node descriptions.
-
A “percent-done” graphic is shown next to long running nodes. This is currently available as an estimate based on previous runtimes.
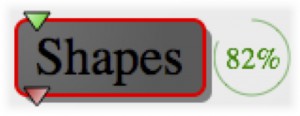
Percent done.
- Data sharing between GPI processes has been threaded to prevent the GUI from locking up on large data sets.
- Node menus now have a corner grip (arguably one of the most important updates in Aughty) and a “Close-all” feature located in the main menu.
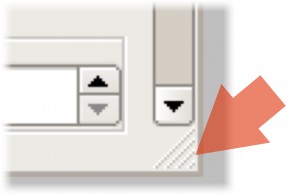
The corner grip.
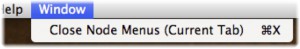
Close all menu option.
Commandline Interface
- The commandline interface allows GPI to run as a scriptable element in a batch process.
- String arguments can be passed to String nodes allowing networks to be parameterized with filenames, directories, numbers and anything passable via a string.
- Multiple networks, nodes, and associated files can be passed as commandline arguments for quick workspace loading.
- The log level can also be pre-set using this interface.
Config File (.gpirc) - A configuration file in the user’s home directory can be used to set node-library paths, file associations and configure the gpi_make.
- Library paths set in this file will also be included in the gpi_make for cross-library-linking and include file resolution. 2-Level Library Scope
- Libraries are now 2-levels allowing developers to have their own library and use sub-library names that alias the ‘core’ packaged library.
- Nodes are now searched for by scope allowing multiple nodes to have the same name.
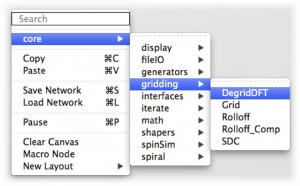
2-level library scope.
Network File Upgrade (v2)
- The network files now save information about node and canvas timing, machine specs and the new library scope.
- The new format is mostly backwards compatible with pre-v2 networks (provided that all the nodes are also included in the library path).
PyFI
- The Python Function Interface code has been updated with a new Array package (similar to the R2 arrays). This packages provides slightly faster indexing, and index range check mode (for debugging), stacktraces and a simple FFTW interface.
- A PyCallable interface object has also been added for embedding Python calls in C++. This provides a simple interface for calling functions that may not yet be available in the C++ interface, but allow the developer to leverage the vast Python library. Included interfaces are Numpy::pinv() (pseudo inverse), Numpy::printArray(), Numpy::fft1() as examples of how this may be used.
- Error messages now demangle the variable types, for easier error interpretation.
- Support for C++ templated functions -providing a way of making typed functions available to Python.
- Updated PyFI macros further reduce the amount of code needed to define a PyMOD. NodeAPI
- Support for initUI() return codes.
- New event API that keeps all events that initiated execution. Added deprecations warnings to the old interface.
Nodes
- All ‘core’ PyMODs have been updated to use the new PyFI::Array class.
- ReadPhilips now supports a lab/raw/sin reader, xml/par/rec (with HIFU bug fixes), noise and phase correction outputs and an updated display that includes labels for dimensions.
- The ‘mathematics’ library has been renamed to ‘math’.
- Elem_Math node has been renamed to Math.
- Added ReadImage & WriteImage for .png or .jpg.
- Added DataQuery for looking through data arrays.
- Added ImageCompare & ImageRate for performing paired comparisons.
- Updated DictionQuery to use a search key.
- Added ReadCSV & WriteCSV for ascii, comma separated values.
- Added ReadHDF5 & WriteHDF5 (still basic, under development).
- Added ReadPhysioLog for scanner physiologic sensor recordings.
- Added DegridDFT for trajectory data simulation.
- Added Alert for making a noise when a process has finished.
- Added AutoNum in place of IntegerLoop (does float, int, and has a better UI).
- Compare (find scale RMS diff between two NPY arrays).
- Updated Dimensions to handle events.
- Updated the ToComplex UI.
Bugfixes
- Networks correctly save widget-port connections.
- Corrected getWidget() error message (the bug threw exception during the error message creation) when using methods like getAttr() or setAttr().
- Better node-process stability: fixed an issue causing zombie processes.